Understanding how users spend their time on your site helps you understand your site’s strengths and weaknesses. Calculating the time spent on a page is the key metric for doing this. In this tutorial, we show you how to calculate time on page and related metrics using PostHog.
The challenge with time on page is measuring activity. Because of the event-driven structure of PostHog, we can’t be 100% sure a session is active at any point. Instead, we can estimate time spent by getting the time between a first pageview event and a subsequent pageview or pageleave event, filtering out extreme values, and averaging these together.
Calculating average time on page
To calculate the average time on page, we must create a SQL insight. To do this, create a new insight and select the SQL tab. Here we write a HogQL expression to:
- Get
$pageview
and$pageleave
events from 2023 - Use a
WINDOW
function to get the next$pageview
or$pageleave
event after the initial$pageview
event. - Use a
dateDiff
function to get the difference between the initial timestamp and the subsequent event’s timestamp as the time on page for each pageview. - Average the time on page for all the pageviews.
Altogether, this looks like this:
SELECT avg(time_on_page) AS avg_time_on_pageFROM (SELECTdateDiff('minute', first_timestamp, next_timestamp) AS time_on_pageFROM (SELECTdistinct_id,event AS first_event,timestamp AS first_timestamp,first_value(event) OVER w AS next_event,first_value(timestamp) OVER w AS next_timestampFROM eventsWHEREtimestamp > toDateTime('2023-01-01 00:00:00')AND (event = '$pageview' OR event = '$pageleave')WINDOW w AS (PARTITION BY distinct_id ORDER BY timestamp ASC ROWS BETWEEN 1 FOLLOWING AND 1 FOLLOWING)ORDER BY distinct_id, timestamp) AS subqueryWHERE first_event = '$pageview'AND (next_event = '$pageleave' OR next_event = '$pageview'))
After running this query, you might notice that the result is very high. Industry averages range from 40 to 80 seconds, not the 180 minutes I got from PostHog’s data. This is because it includes situations where the subsequent event is months afterward.
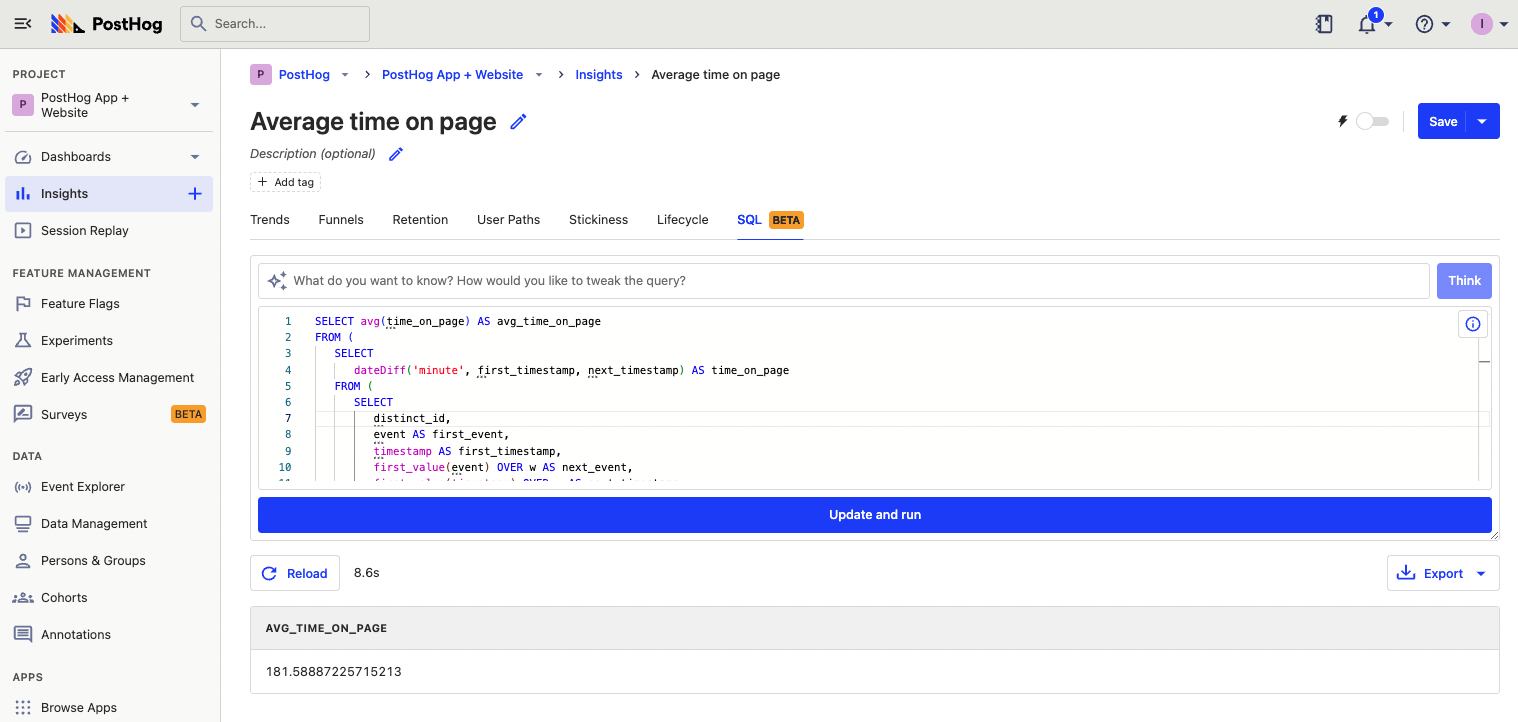
We can limit this by filtering out time_on_page
values that are greater than 30 minutes. These are likely inactive and separate sessions. Both PostHog and Google Analytics count a 30 minute gap as inactivity.
SELECT avg(time_on_page) AS avg_time_on_pageFROM (SELECTdateDiff('minute', first_timestamp, next_timestamp) AS time_on_pageFROM (SELECTdistinct_id,event AS first_event,timestamp AS first_timestamp,first_value(event) OVER w AS next_event,first_value(timestamp) OVER w AS next_timestampFROM eventsWHEREtimestamp > toDateTime('2023-01-01 00:00:00')AND (event = '$pageview' OR event = '$pageleave')WINDOW w AS (PARTITION BY distinct_id ORDER BY timestamp ASC ROWS BETWEEN 1 FOLLOWING AND 1 FOLLOWING)ORDER BY distinct_id, timestamp) AS subqueryWHERE first_event = '$pageview'AND (next_event = '$pageleave' OR next_event = '$pageview')AND time_on_page <= 30 /* new */)
This gives us a reasonable value for the average time on page.
Calculating time on page for specific pages
We can dive further into time on page to get the average time on page for different pages on our site. This lets us know what areas users are finding interesting (or not).
To do this, we select the properties.$current_url
for our events, group by that value, and sort avg_time_on_page
from largest to smallest.
SELECTavg(time_on_page) AS avg_time_on_page,current_url /* new */FROM (SELECTdateDiff('minute', first_timestamp, next_timestamp) AS time_on_page,current_url /* new */FROM (SELECTdistinct_id,event AS first_event,timestamp AS first_timestamp,first_value(event) OVER w AS next_event,first_value(timestamp) OVER w AS next_timestamp,properties.$current_url as current_url /* new */FROM eventsWHEREtimestamp > toDateTime('2023-01-01 00:00:00')AND (event = '$pageview' OR event = '$pageleave')WINDOW w AS (PARTITION BY distinct_id ORDER BY timestamp ASC ROWS BETWEEN 1 FOLLOWING AND 1 FOLLOWING)ORDER BY distinct_id, timestamp) AS subqueryWHERE first_event = '$pageview'AND (next_event = '$pageleave' OR next_event = '$pageview')AND time_on_page <= 30)GROUP BY current_url /* new */ORDER BY avg_time_on_page DESC /* new */
If you have a high-traffic site with many unique URLs, you might have many unique pages with 30 minute average time_on_page
values at the top of your list. To limit this and get more useful information, you can filter for pageview events from specific sections of your site.
For example, to get the time on site for blog pages we can add another filter for properties.$current_url LIKE '%posthog.com/blog%'
.
SELECTavg(time_on_page) AS avg_time_on_page,current_urlFROM (SELECTdateDiff('minute', first_timestamp, next_timestamp) AS time_on_page,current_urlFROM (SELECTdistinct_id,event AS first_event,timestamp AS first_timestamp,first_value(event) OVER w AS next_event,first_value(timestamp) OVER w AS next_timestamp,properties.$current_url as current_urlFROM eventsWHEREtimestamp > toDateTime('2023-01-01 00:00:00')AND (event = '$pageview' OR event = '$pageleave')AND properties.$current_url LIKE '%posthog.com/blog%' /* new */WINDOW w AS (PARTITION BY distinct_id ORDER BY timestamp ASC ROWS BETWEEN 1 FOLLOWING AND 1 FOLLOWING)ORDER BY distinct_id, timestamp) AS subqueryWHERE first_event = '$pageview'AND (next_event = '$pageleave' OR next_event = '$pageview')AND time_on_page <= 30)GROUP BY current_urlORDER BY avg_time_on_page DESC
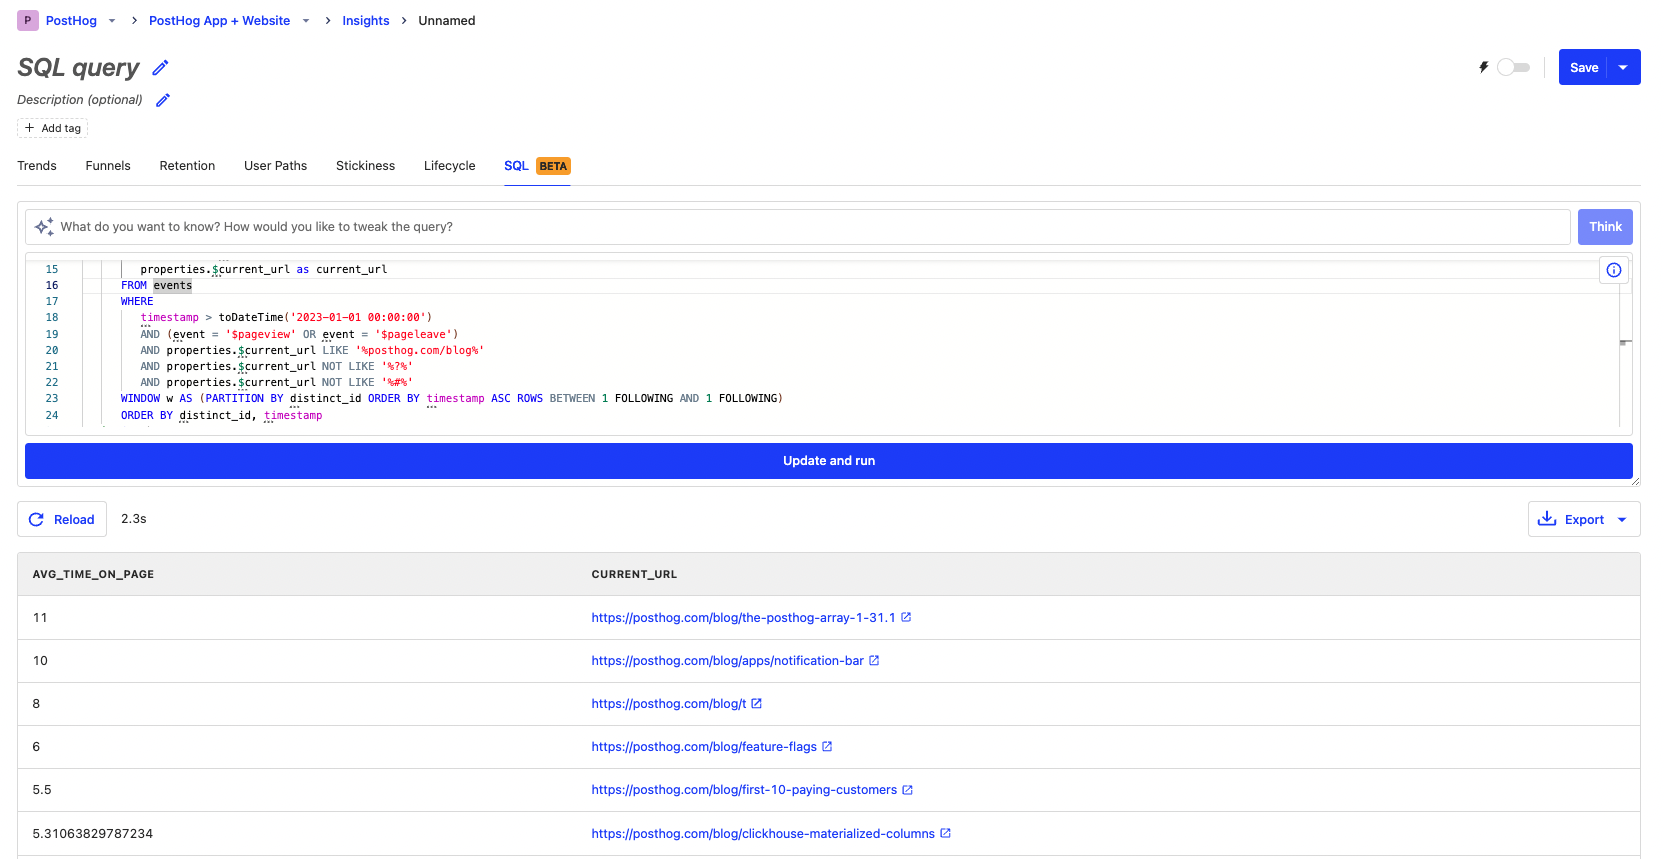
One last thing you might want to filter out is URLs with question marks or number signs. To do this add the statements AND properties.$current_url NOT LIKE '%?%'
and AND properties.$current_url NOT LIKE '%#%'
below the properties.$current_url LIKE '%posthog.com/blog%'
filter. This cleans the URLs.
Time on page for an individual page
We can get the time on page for an individual page by filtering for events where the properties.$current_url
equals the page you’re interested in. For example, to get the time on page for our session metrics tutorial, we can filter for events where properties.$current_url = 'https://posthog.com/tutorials/session-metrics'
.
SELECTavg(time_on_page) AS avg_time_on_pageFROM (SELECTdateDiff('minute', first_timestamp, next_timestamp) AS time_on_pageFROM (SELECTdistinct_id,event AS first_event,timestamp AS first_timestamp,first_value(event) OVER w AS next_event,first_value(timestamp) OVER w AS next_timestamp,properties.$current_url as current_urlFROM eventsWHEREtimestamp > toDateTime('2023-01-01 00:00:00')AND (event = '$pageview' OR event = '$pageleave')AND properties.$current_url = 'https://posthog.com/tutorials/session-metrics' /* new */WINDOW w AS (PARTITION BY distinct_id ORDER BY timestamp ASC ROWS BETWEEN 1 FOLLOWING AND 1 FOLLOWING)ORDER BY distinct_id, timestamp) AS subqueryWHERE first_event = '$pageview'AND (next_event = '$pageleave' OR next_event = '$pageview')AND time_on_page <= 30)ORDER BY avg_time_on_page DESC
If you want to see a list of events and user distinct IDs that make up that value, you can remove the average time on page calculation, show distinct IDs, and sort by time_on_page
.
SELECTdateDiff('minute', first_timestamp, next_timestamp) AS time_on_page,distinct_idFROM (SELECTdistinct_id,event AS first_event,timestamp AS first_timestamp,first_value(event) OVER w AS next_event,first_value(timestamp) OVER w AS next_timestampFROM eventsWHEREtimestamp > toDateTime('2023-01-01 00:00:00')AND (event = '$pageview' OR event = '$pageleave')AND properties.$current_url = 'https://posthog.com/tutorials/session-metrics'WINDOW w AS (PARTITION BY distinct_id ORDER BY timestamp ASC ROWS BETWEEN 1 FOLLOWING AND 1 FOLLOWING)ORDER BY distinct_id, timestamp) AS subqueryWHERE first_event = '$pageview'AND (next_event = '$pageleave' OR next_event = '$pageview')AND time_on_page <= 30ORDER BY time_on_page DESC